Skip to content
Inside Korea: Your Gateway to K-Stock Insights
Welcome to Inside Korea Hub
Inside Korea Hub Inside Korea Hub

Your Essential Guide to Everything Korea

Inside Korea Hub Inside Korea Hub

Your Essential Guide to Everything Korea

  • Market Analysis
  • Tech & Semi
  • Hidden Gems
  • Policy & Value-up
  • Market Analysis
  • Tech & Semi
  • Hidden Gems
  • Policy & Value-up
Close

Search

Minimalist mobile-friendly infographic of Samsung Electronics Q1 2026 earnings. Features three massive figures on a black background: 57.2T KRW Operating Profit (~$39B), +4,780% YoY DS Division growth, and 14.6T KRW in treasury shares cancelled for shareholder value-up.
Tech & Semi

Samsung’s 57.2T KRW Earnings Surge: Why the DS Division’s 4,780% Growth is Just the Beginning

Unknown's avatar
By Editor Hoi
April 30, 2026 2 Min Read
0

[Key Insights at a Glance]

  • 57.2T KRW (~$39B) Operating Profit: Total profit surged 760% YoY, with the DS division alone contributing 53.7T KRW (4,780% YoY) — 94% of group operating profit.
  • DRAM +91% / NAND +88% ASP (QoQ): Server shipments hit a quarterly record as AI demand overwhelms available supply. Fulfillment rate is now at an all-time low.
  • ₩14.6T Share Cancellation: 73.36M common + 13.6M preferred shares retired, directly boosting EPS.

[Deep Dive Analysis]

Q1 2026 confirms this is no ordinary upcycle. Agentic AI is driving simultaneous demand across both AI and general-purpose servers — and supply simply cannot keep up. New fab lead times create a hard ceiling on capacity expansion, pushing Samsung’s demand fulfillment rate to an all-time low. Customers are already booking 2027 volumes, and the supply gap is expected to widen further.

To lock in this visibility, Samsung is converting customer demand into binding Long-Term Agreements — a structural shift from the informal arrangements of prior cycles that materially reduces earnings volatility going forward.

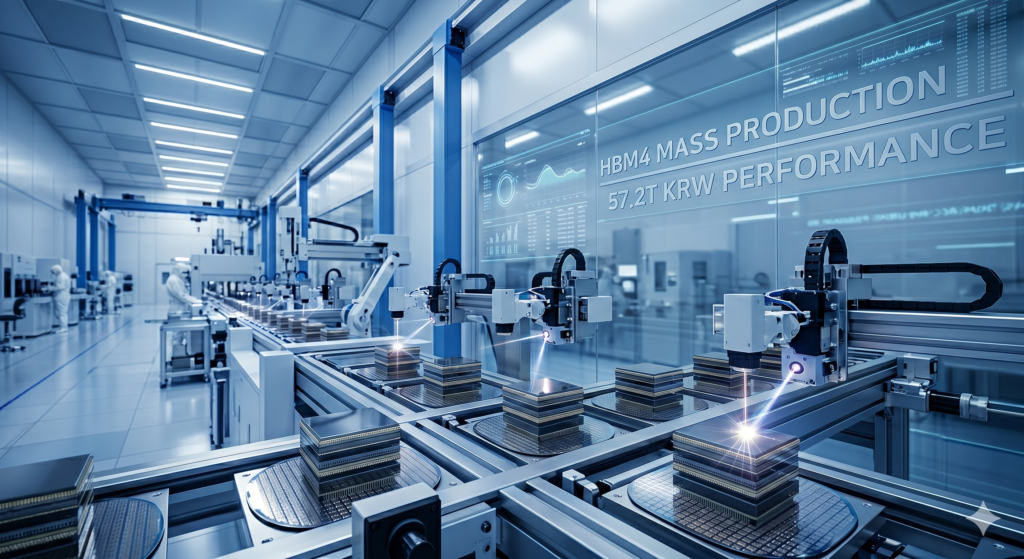
The current “Dual Market” dynamic is worth watching closely. General DRAM is temporarily outpacing HBM on profitability due to faster quarterly pricing resets. But with HBM’s supply-demand gap widening, Samsung expects this gap to reverse significantly by 2027. HBM revenue is forecast to more than triple YoY, with HBM4 — now in mass shipment — exceeding 50% of total HBM revenue from Q3 onward. HBM4e samples follow in Q2. On the NAND side, Samsung is targeting early leadership in the PCIe Gen 6 server SSD market in H2 2026.

One near-term watch item: the union has announced a general strike (May 21–June 7). Management has contingency plans in place, but any bonus settlement could create a Q2 earnings headwind not yet reflected in numbers.


[💡 Editor Hoi’s Strategic Insight]

Three forces are compounding at once — ASPs rising faster than expected, LTA contracts building multi-year revenue visibility, and a ₩14.6T buyback amplifying per-share earnings. The near-term noise (strike risk, Q2 provisioning) is real but looks transient against a backdrop where 2027 orders are already queued and supply remains structurally constrained. This is a structural re-rating story, not a cyclical peak.

Tags:

DS DivisionQ1 2026 EarningsSamsung ElectronicsSamsung Semiconductor
Unknown's avatar
Author

Editor Hoi

Editor Hoi is a seasoned investment analyst based in Seoul, specializing in the Korean stock market (KOSPI). Providing insightful, data-driven analysis for global investors seeking unique opportunities in South Korea.

Follow Me
Other Articles
Financial infographic showing KOSPI breaking 6,600 with a record $4.4 Trillion market cap. Highlights include a low 7.3x PER, a 29.8% upward earnings revision, and South Korea's #1 performance ranking among G20 markets for 2026.
Previous

KOSPI Breaches 6,600: Korea’s $4.4T Market Cap Milestone as Earnings Confirm the Re-Rating

Comprehensive infographic of Pan Ocean's 1Q26 performance, highlighting the strategic shift to a global energy shipping leader. Includes BDI surge chart, 140.9 Billion KRW operating profit, and the 53% non-bulk profit share milestone from LNG and Tanker operations.
Next

Pan Ocean’s 140.9B KRW Surprise: The Ultimate “Value-Up” Hidden Gem in Korea’s Energy Shift

No Comment! Be the first one.

Leave a Reply Cancel reply

Your email address will not be published. Required fields are marked *

Recent Posts

  • Pan Ocean’s 140.9B KRW Surprise: The Ultimate “Value-Up” Hidden Gem in Korea’s Energy Shift
  • Samsung’s 57.2T KRW Earnings Surge: Why the DS Division’s 4,780% Growth is Just the Beginning
  • KOSPI Breaches 6,600: Korea’s $4.4T Market Cap Milestone as Earnings Confirm the Re-Rating
  • The KRW 70T Megatrend: Why SungEel HiTech is the Strategic “Pure Play” in Global Battery Recycling
  • The 60% High-Tech Mandate: How Korea’s “National Growth Fund” Triggers a Structural Value-Up and Foreign Capital Influx
Copyright 2026 — Inside Korea Hub. All rights reserved.