


The $13.2B Atomic Shift: Why Global Giants are Eyeing Jusung Engineering’s ALD Mastery
[Key Insights at a Glance] [Deep Dive: The End of CVD, The Era of Atoms] Source: Jusung Engineering Guidance Series ALD & CVD Semiconductor Equipment As memory architectures evolve into extreme 3D vertical stacks, traditional deposition (CVD) is…

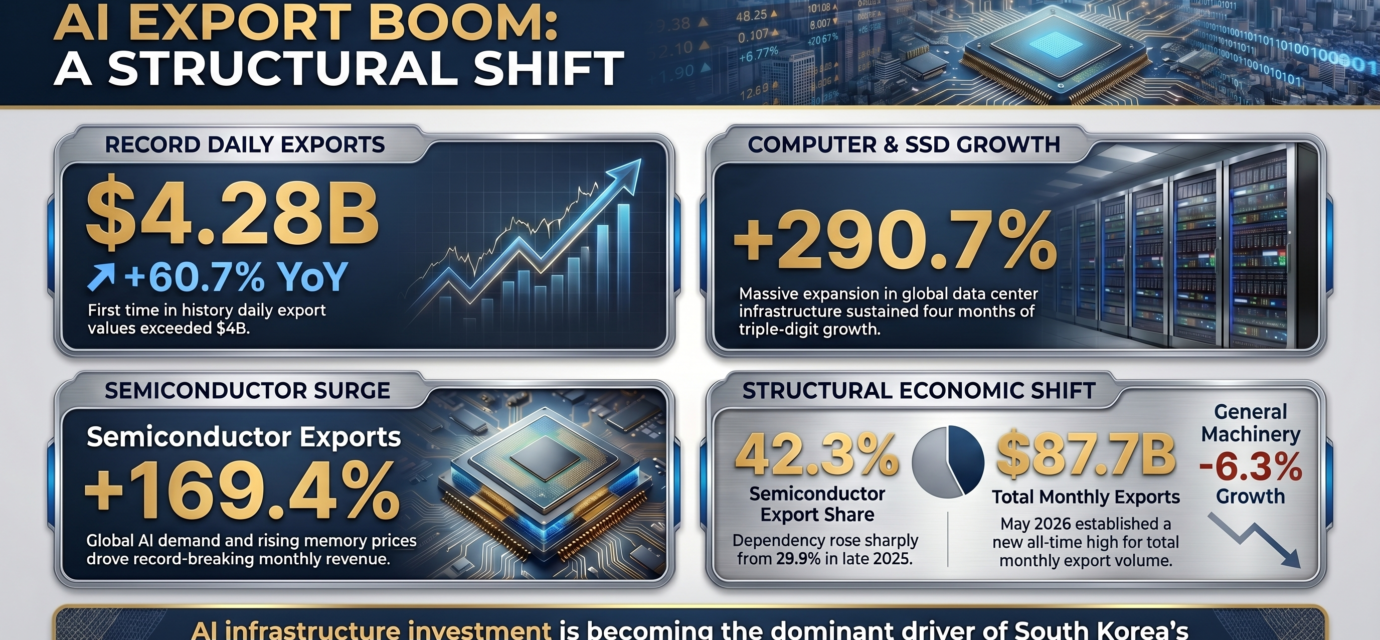
The 152.5% Export Boom: Why Korea’s AI Chips are Defying Geopolitical Risks
[Summary] While Middle East tensions and structural inflation are raising global alarms, South Korea’s economy is showing remarkable resilience. Driven by a massive 152.5% YoY surge in semiconductor exports, the “K-Tech Rally” is effectively…

The 100% Disclosure Mandate: How Korea’s New Treasury Stock Rules Spark a Structural Re-rating
[Key Insights at a Glance] [Deep Dive Analysis] The Financial Services Commission (FSC) has initiated a legislative notice (March 31 – May 11, 2026) that marks a definitive end to the “Korea Discount”. By enforcing the mandatory cancellation…

The 65% Profit Surge: Why EO Technics is the Unsung Hero of Samsung’s HBM4 and Nvidia’s AI Chips
[Key Insights at a Glance] [Deep Dive: Beyond the Cyclical Noise] EO Technics is entering a structural re-rating phase. While the market might be distracted by short-term one-off expenses (like the recent bonus payouts), the fundamental story is stronger…

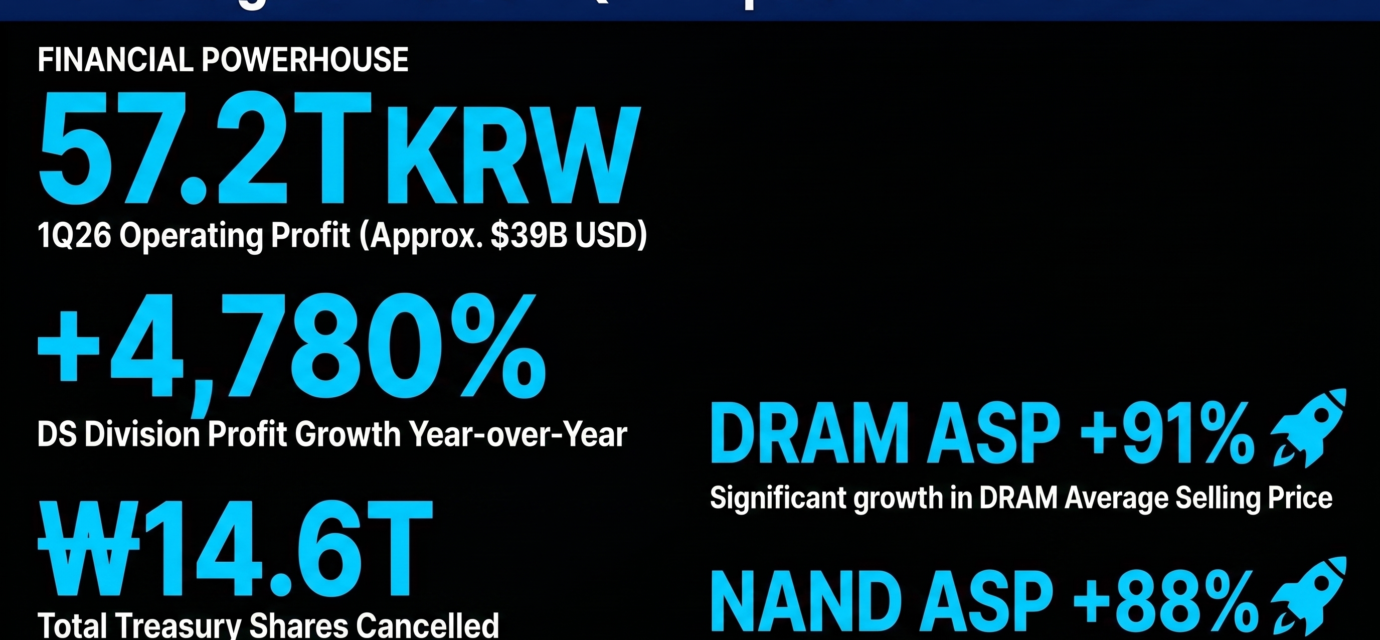
Samsung’s 57.2 Trillion KRW Shock: Why the “Memory Re-Rating” is No Longer a Theory
Key Insights at a Glance Deep Dive Analysis Samsung’s announcement on April 7, 2026, didn’t just beat expectations—it rewrote South Korean corporate history. With a staggering 57.2 trillion KRW in operating profit and 133 trillion KRW in revenue,…
K-Semiconductor Alert: Why Recent DRAM Spot Price Dips are a “Buy the Dip” Opportunity
Recent jitters in the South Korean semiconductor sector have led to a slight correction in stock prices. However, according to the latest sector report from DS Investment & Securities (April 1, 2026), this is a “normalization process”…

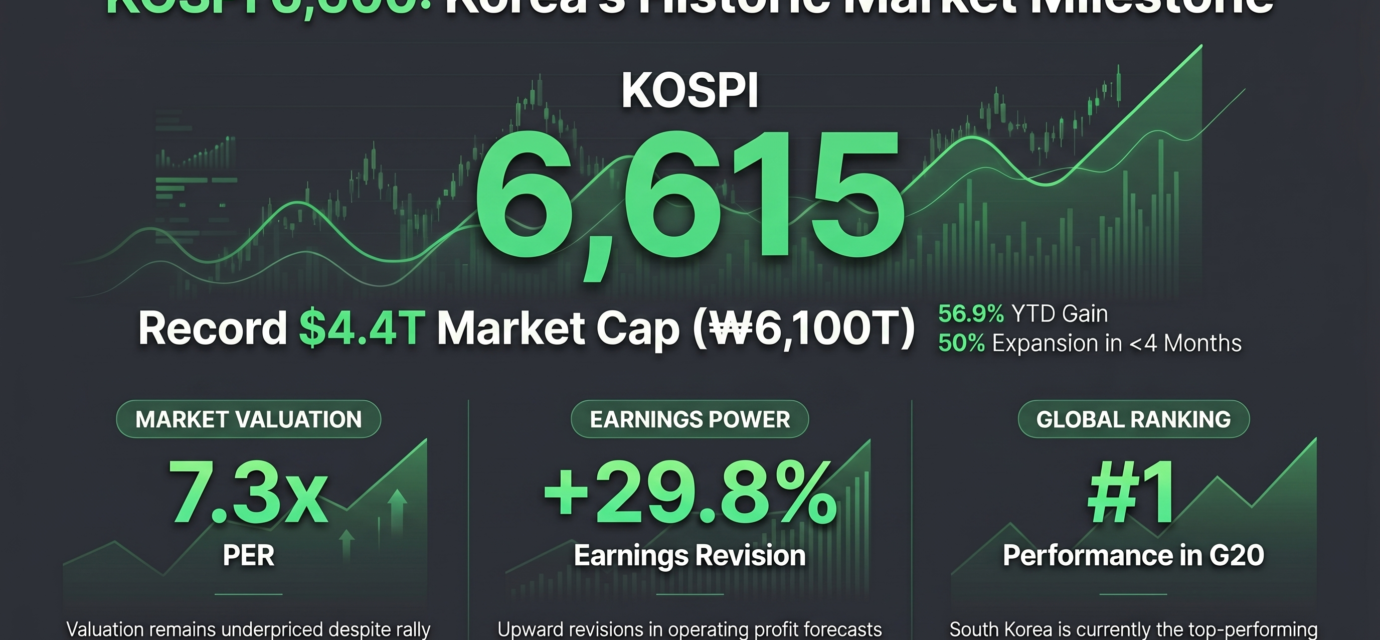
KOSPI Market Outlook April 2026: Key Drivers and Investment Strategies for the Korean Stock Market
As we enter April 2026, the South Korean stock market (KOSPI) is facing a pivotal moment. Investors worldwide are closely monitoring the interplay between global economic shifts and local policy initiatives. Here is a comprehensive outlook for the KOSPI…